
An electrocardiogram is a picture of the electrical conduction of the heart. By examining changes from normal on the ECG, clinicians can identify a multitude of cardiac disease processes.
There are two ways to learn ECG interpretation — pattern recognition (the most common) and understanding the exact electrical vectors recorded by an ECG as they relate to cardiac electrophysiology — and most people learn a combination of both. This tutorial pairs the approaches, as basing ECG interpretation on pattern recognition alone is often not sufficient.
Parts of an ECG
The standard ECG has 12 leads. Six of the leads are considered “limb leads” because they are placed on the arms and/or legs of the individual. The other six leads are considered “precordial leads” because they are placed on the torso (precordium).
The six limb leads are called lead I, II, III, aVL, aVR and aVF. The letter “a” stands for “augmented,” as these leads are calculated as a combination of leads I, II and III.
The six precordial leads are called leads V1, V2, V3, V4, V5 and V6.
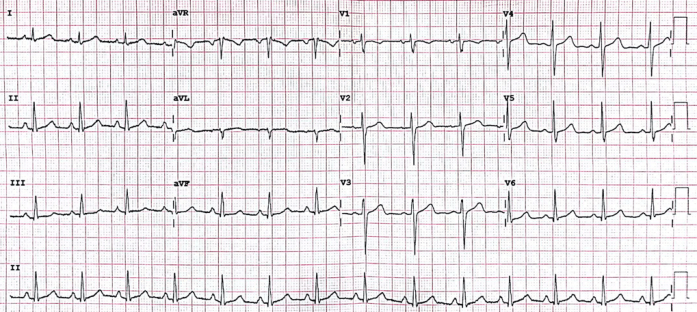
Below is a normal 12-lead ECG tracing. The different parts of the ECG will be described in the following sections.
The Normal ECG
A normal ECG contains waves, intervals, segments and one complex, as defined below.
Wave: A positive or negative deflection from baseline that indicates a specific electrical event. The waves on an ECG include the P wave, Q wave, R wave, S wave, T wave and U wave.
Interval: The time between two specific ECG events. The intervals commonly measured on an ECG include the PR interval, QRS interval (also called QRS duration), QT interval and RR interval.
Segment: The length between two specific points on an ECG that are supposed to be at the baseline amplitude (not negative or positive). The segments on an ECG include the PR segment, ST segment and TP segment.
Complex: The combination of multiple waves grouped together. The only main complex on an ECG is the QRS complex.
Point: There is only one point on an ECG termed the J point, which is where the QRS complex ends and the ST segment begins.
The main part of an ECG contains a P wave, QRS complex and T wave. Each will be explained individually in this tutorial, as will each segment and interval.
The P wave indicates atrial depolarization. The QRS complex consists of a Q wave, R wave and S wave and represents ventricular depolarization. The T wave comes after the QRS complex and indicates ventricular repolarization.
دیدگاه خود را بنویسید